
Smash burger
Star- Sold
- 486
- Contribution
- $13.66
RESTAURANT FOOD COSTING SOFTWARE
Turn vendor invoice prices into recipe costs for food and drinks. Compare those costs with POS sales to guide menu pricing and see what each menu item contributes before labor and overhead.
Included in the Operations Bundle. View plans
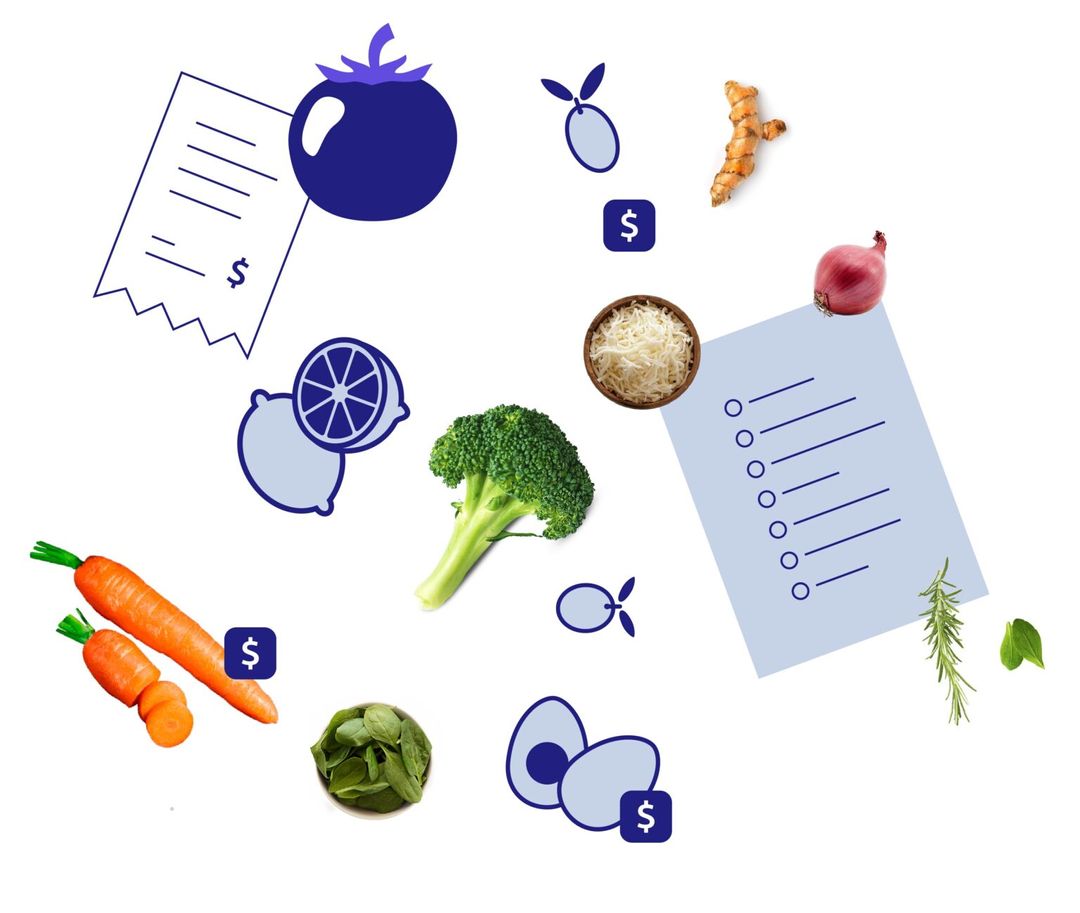
From delivery to recipe
Invoice prices update ingredient costs using your chosen costing method. Pack sizes, units, and yields carry through to the recipes that use them.
6 × 1 L case
$101.48 ÷ 6 liters
$16.91 × 0.03 L
The detail behind the total
See the ingredient cost behind every dish and drink, with quantities, yields, sub-recipes, and vendor prices behind the total.
Actual vs. theoretical usage
Compare stock used between two completed counts with expected usage from mapped POS sales. Recorded waste and loss adjustments help explain the difference.
Customer story
Read the story“Opsi has been a great partner in our tech stack. We are pleased with the ongoing improvements being made for a flawless integration with our GoTab POS.”
Practical questions
Understand the difference between a dish’s recipe cost and the food cost of running your restaurant.
How to calculate food cost and recipe costDivide the ingredient cost per portion by the menu price, then multiply by 100. A dish that costs $4.34 to make and sells for $18 has a 24.1% food cost. Include sub-recipes, garnishes, unit conversions, and usable yields so the plate cost reflects what you serve.
Menu engineering compares how often menu items sell with how much each contributes after ingredient cost. Opsi combines mapped POS sales with recipe costs to compare dishes or drinks within a menu category. Use the results to consider portion sizes, placement, and pricing; contribution is before labor and other operating expenses.
Recipe costs describe the ingredients a dish should use. Actual food cost depends on inventory and purchases over a period, including what was wasted, transferred, or adjusted. Comparing actual usage with sales-based theoretical usage helps reveal differences worth investigating.
See opsi in your operation
See how opsi connects the work behind service in a demo focused on your restaurant’s priorities. No documents or advance setup required.